


Point-in-Time Count
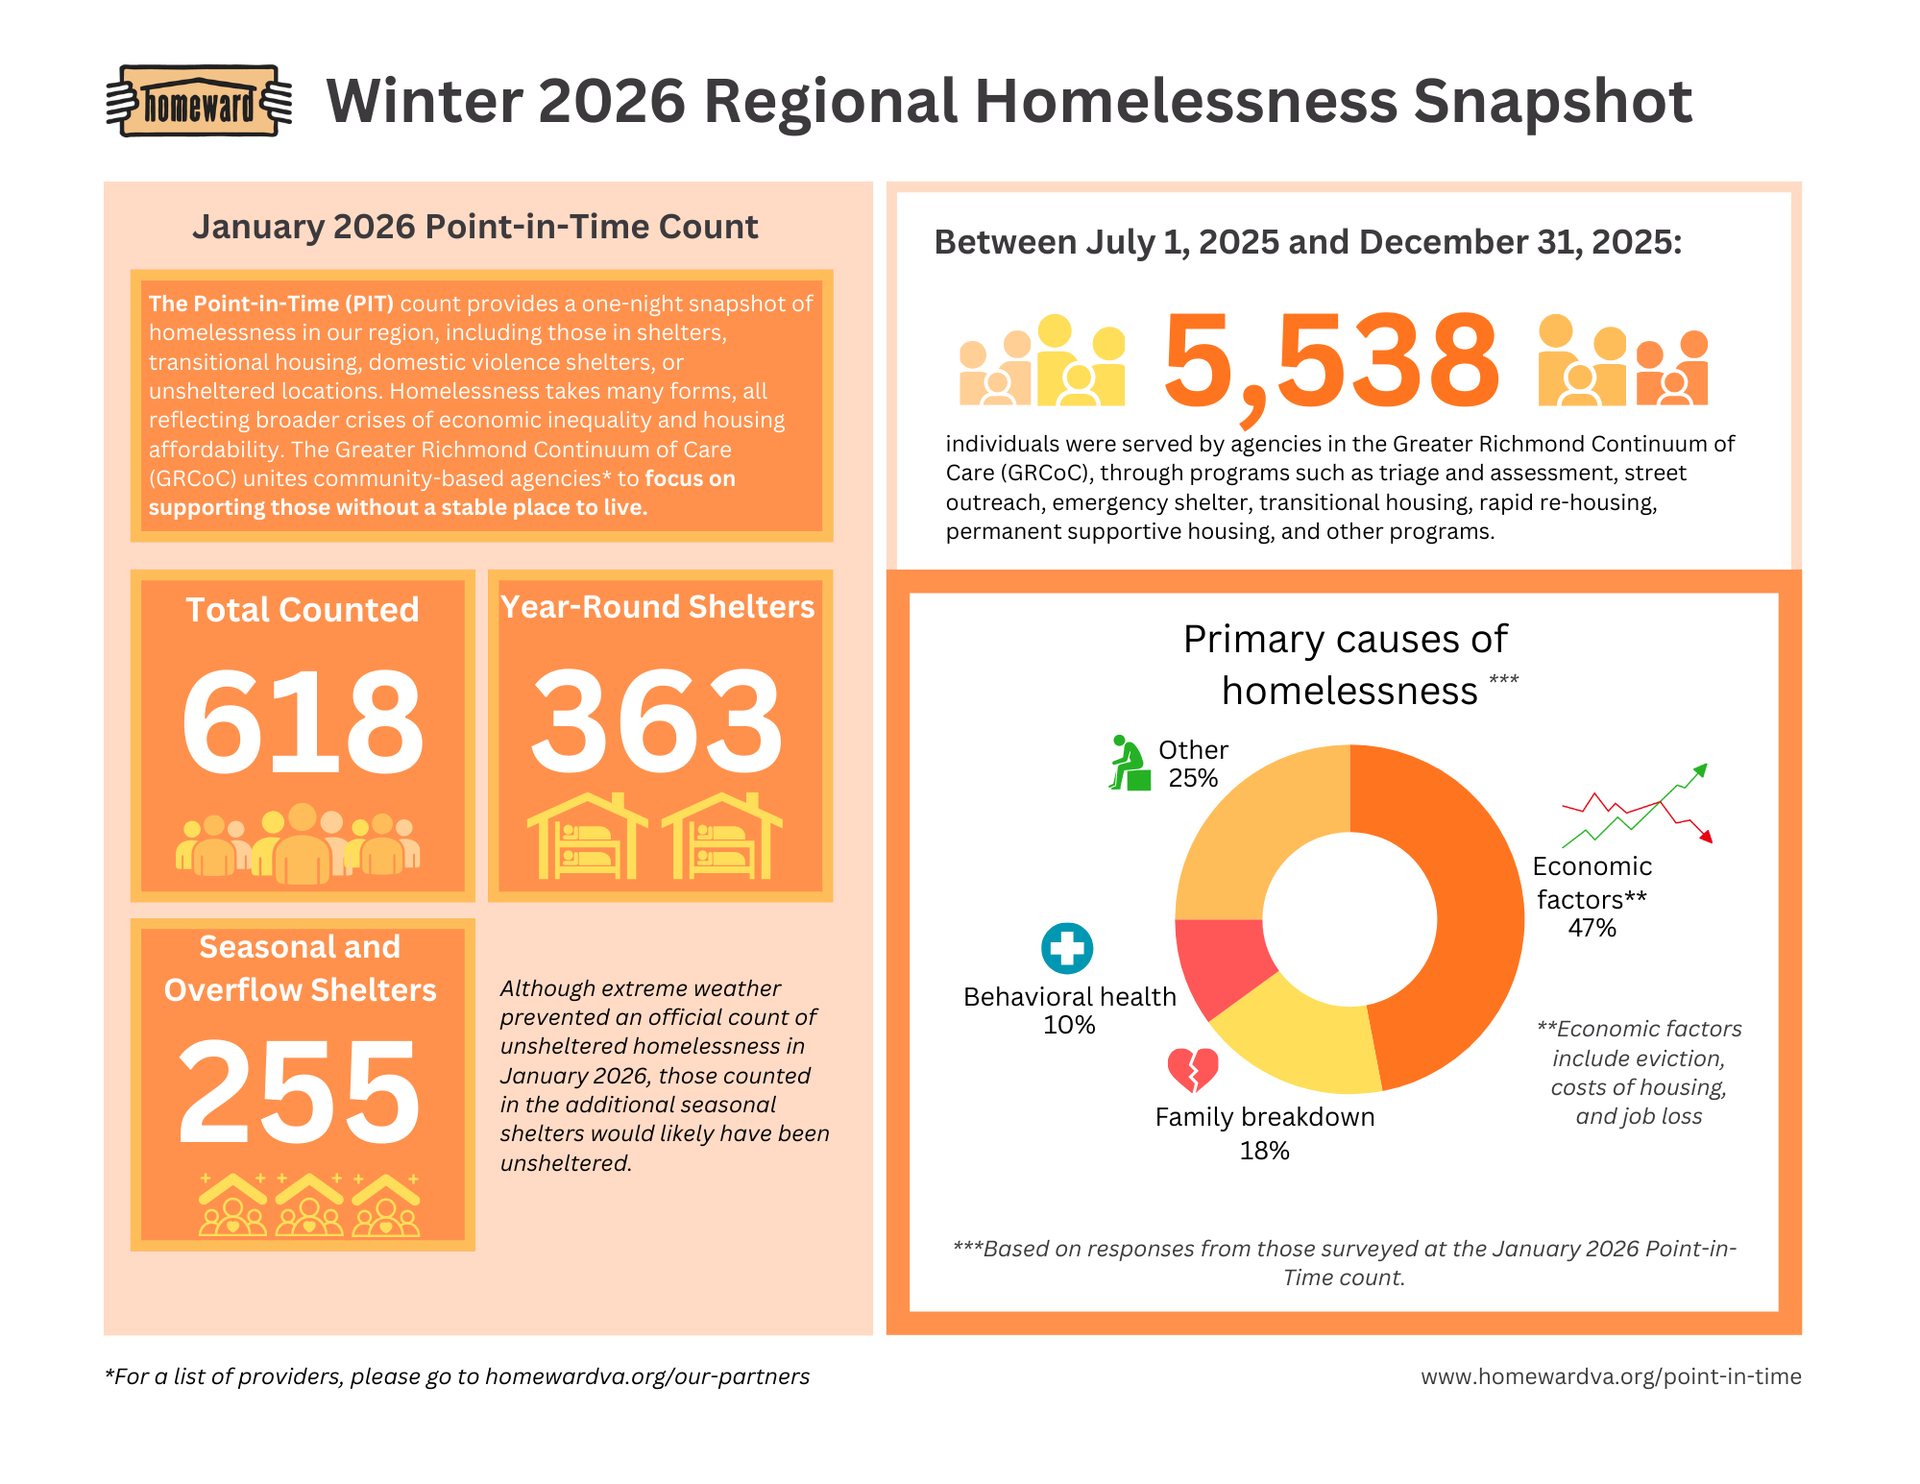
Thank you to our PIT partners!
ACTS ~ Bridges of Change ~ CARITAS ~ Colonial Heights ~ Chesterfield County ~ Commonwealth Catholic Charities ~ Daily Planet Health Services ~ Goochland County ~ Hanover County ~ Hanover Safe Place ~ Henrico County ~ HomeAgain ~ Housing Families First ~ The James House ~ Liberation Veteran's Services ~ Powhatan County ~ Richmond Behavioral Health Authority ~ Richmond City ~ Safe Harbor ~ The Salvation Army ~ Span Center ~ St. Joseph's Villa ~ Virginia Home for Boys and Girls ~ SupportWorks Housing ~ YWCA
Point-in-Time Count FAQ
-
What is the Point-in-Time Count?
Conducted by Homeward, the federally-mandated PIT count took place on July 24, 2025. This single day count provides a snapshot of changes and trends over time related to individuals and families experiencing homelessness in our region. PIT data are based on the actual numbers of people counted by experienced and trained volunteers.
-
Who is counted?
Homeward staff partner with shelter providers, street outreach providers, and trained and experienced volunteers to count and gather information about people staying in shelter programs and those sleeping outside or in other places not meant for human habitation (such as in cars). They survey a sample of individuals about their experiences, which provides further insight directly from people with current lived experience of homelessness.
-
How do you define homelessness?
There are many definitions of homelessness and each of these represents real needs in our community as part of larger crises related to economic inequality and a lack of affordable housing. The Greater Richmond Continuum of Care (GRCoC) – our region’s coordinated and compassionate network of community-based nonprofits, local governments, and others providing homeless services – focuses on the needs of our neighbors without a stable place to live. The GRCoC uses the United States Department of Housing and Urban Development’s (HUD) definition of homelessness to conduct the PIT count. We use that definition because it is how the federal government sets policy and funding for community coalitions like the GRCoC. HUD defines homelessness as including people staying in area shelters, such as emergency shelter, transitional housing, and sexual and domestic violence shelter providers; and individuals staying outdoors or in a place not meant for human habitation.
-
How do you define unsheltered homelessness?
The GRCoC uses HUD’s definition of unsheltered homelessness, which includes individuals staying
outdoors or in a place not meant for human habitation, such as a car, a tent in the woods, or on the streets.
-
How do you make sure you don't double count people?
Homeward coordinates the count with our GRCoC partners in order to survey people experiencing
unsheltered homelessness and those staying in emergency shelters. We work closely with coordinated street outreach partner agencies and with local public sector partners who are familiar with the people experiencing unsheltered homelessness. We also include a few questions in our voluntary survey such as the first two initials of someone’s first and last name as well as their birthdate, age, race, and gender and can use these data elements to ensure that we do not double count people.
-
Why aren’t people living in hotels counted?
Unfortunately, there are many people who are forced to live in hotels or double up with relatives. This is the reality of housing instability for too many in our region. We are grateful that they have access to safe and warm accommodation and also understand that they don’t have a permanent home of their own. In order to have as accurate a count as possible, Homeward follows extensive guidelines, including resource coordination with GRCoC partners. Furthermore, not everyone living in a hotel meets the HUD definition of homelessness. For more details on how the county is conducted, please reference this GRCoC policy.
-
Why is the rate of homelessness so much higher now than in recent years?
Homelessness is a complex and challenging issue. Just as there is no one solution to address
homelessness, there is no one reason that individuals or families are pushed into homelessness.Although this is a complex issue, recent national research has established a clear correlation between the cost of housing (i.e., rental rates) and the level of homelessness. As the cost of affording a home rises, so too do the number of people experiencing homelessness. Home costs in our region have risen dramatically since the pandemic, providing further evidence of this correlation.
-
Why do people become homeless?
Overall, one characteristic everyone in our community experiencing homelessness has in common is not being able to find housing they can afford. Years of underinvestment in housing that is affordable for people with disabilities, for people new to the workforce, for people struggling with health challenges, for seniors, and for others with low incomes has not kept pace with the need in our community. For example, surveys during the two most recent PIT counts, which took place in July 2025 and January 2024, found that economic factors accounted for over 45 percent of the reason for homelessness in our region while breakdown in family relationship accounted for over 20 percent of the reason for homelessness.
-
Are people who are experiencing homelessness from our region or elsewhere?
Historically, approximately 70% of the people we survey during the PIT count report having their last housing in our region. The vast majority of people experiencing homelessness in our region have lived here and are our neighbors. Some of those surveyed have come from other communities in Virginia with a smaller percentage coming from other states.
-
Do we need more shelter for people experiencing homelessness?
Shelter is an important part of our region’s strategy to address homelessness, but it’s important to remember that permanent housing is the ultimate goal. That’s what people who experience homelessness tell GRCoC agencies and frontline homeless services workers. They want a safe, stable home they can afford.
-
How do you engage with individuals not staying in shelter?
Our regional network of homeless service providers engages with individuals experiencing unsheltered homelessness daily. Throughout the year, teams connect with and support individuals living outside. Street outreach workers help those experiencing unsheltered homelessness access resources and connect them with community-based support, such as meals, healthcare, clothes, and other necessities. More details about the Greater Richmond Continuum of Care’s policy for the PIT count is online here.
More Data Visualization
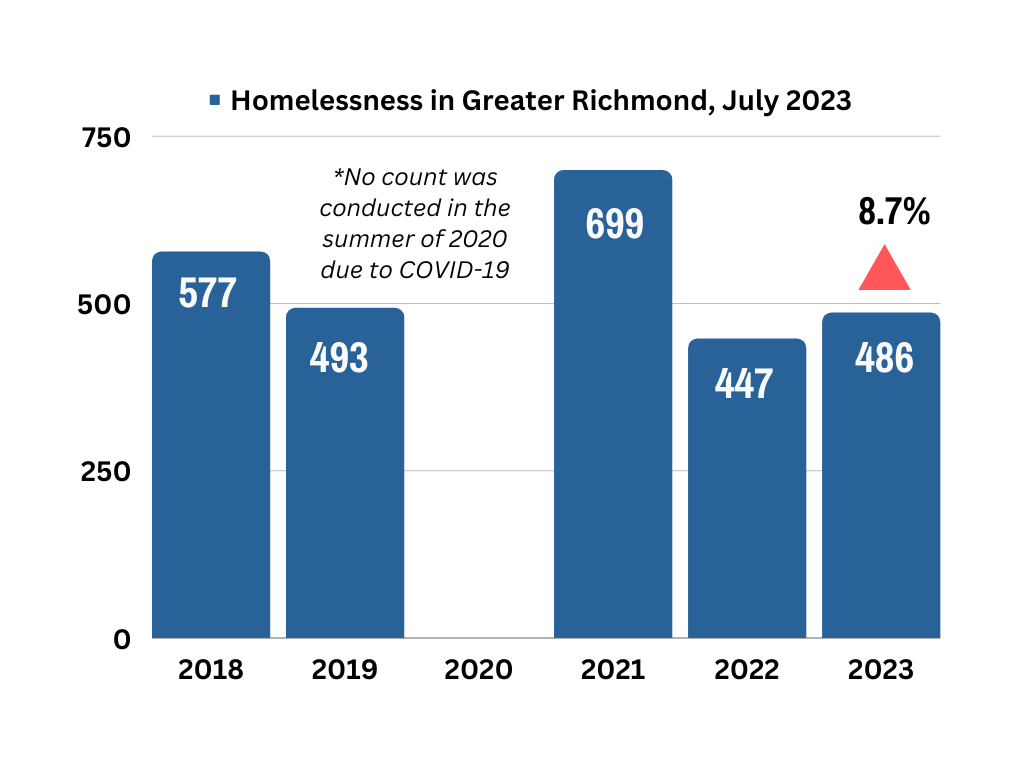
2023 Summer PIT Count Overview
The chart to the left shows Summer PIT count totals for the past 5 years. Note that no count was conducted in July 2020 due to the COVID-19 pandemic.
The July 2023 PIT count recorded 486 people experiencing homelessness, which is 8.7 percent higher than the 447 people recorded in the July 2022 PIT count.
The region’s level of homelessness has remained high since the COVID pandemic because need outpaces capacity of local human services assistance programs and affordable housing resources. Additional investment in the regional homeless assistance network is necessary to serve those experiencing homelessness today and to reduce the level of homelessness in the future.
Low rental vacancy rates and lack of deeply affordable housing remain critical challenges in the greater Richmond area.
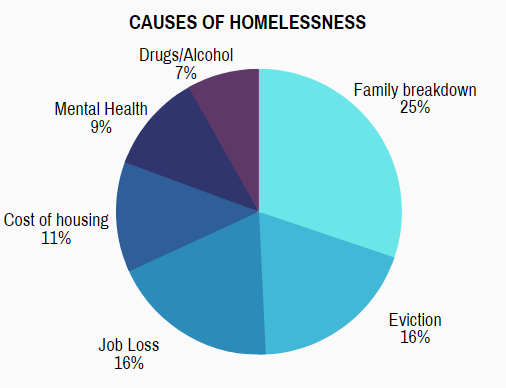
Causes of Homelessness
During the July 2023 PIT count, we asked people about the reasons for their homelessness. Economic strain and hardship collectively accounted for over 40 percent of the reason for homelessness in our region. This finding underscores how economic policies and conditions directly impact the rate of homelessness and force more people into homelessness.
Other common responses, from 25.5 percent of those surveyed, was a breakdown in families or other relationships. Additional reasons were eviction at 16 percent, unemployment or job loss at 15.9 percent, and the cost of housing at 10.5 percent.
Emergency shelter is a life-saving intervention, but quality and affordable housing, steady income, and supportive services that support housing stability end homelessness for our neighbors.
Significant increases in rental rates and the persistence of historically low vacancy rates have yielded more housing instability throughout the Richmond region.
Local programs to address homelessness, coordinated through the GRCoC, have a proven track record of success. These efforts make a difference and need broad community support to ensure that all our neighbors have a place to call home where they can thrive.
Rise in Unsheltered Homelessness
The number of people experiencing unsheltered homelessness – defined as people staying outdoors, in cars, and other places not meant for habitation – remains much higher than our region’s historic average before the COVID pandemic. The July 2023 PIT count recorded 181 people experiencing unsheltered homelessness.
This challenge will require additional resources, including supporting our region's coordinated and compassionate response to homelessness and priortizing building more housing to ensure that everyone has a safe place to call home.
Unsheltered homelessness is defined by the U.S. Department of Housing and Urban Development (HUD) as an individual sleeping in conditions not suitable for human habitation, such as sidewalks, cars, and tents. Higher levels of unsheltered homelessness are expected in the summer when the weather is less of a deterrent to sleeping outside.
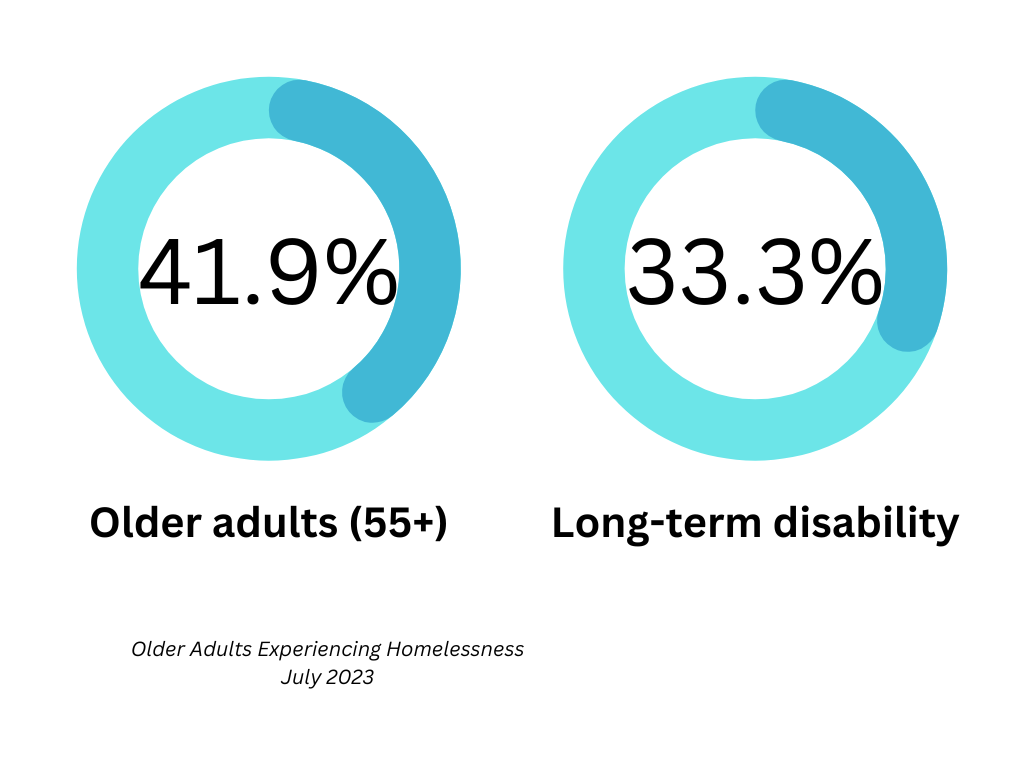
Older Adults
Older adults accounted for 41.9 percent of those counted during the July 2023 PIT count, representing a significant percentage. Additionally, 12.3 percent of adults experiencing homelessness were 65 or older.
These populations present unique challenges for housing because they are far more likely to have a disability (33.3 percent reported a long-term disability), and limited income. Integrating with other systems of care, such as medical and health care, is vital for serving older adults experiencing homelessness.
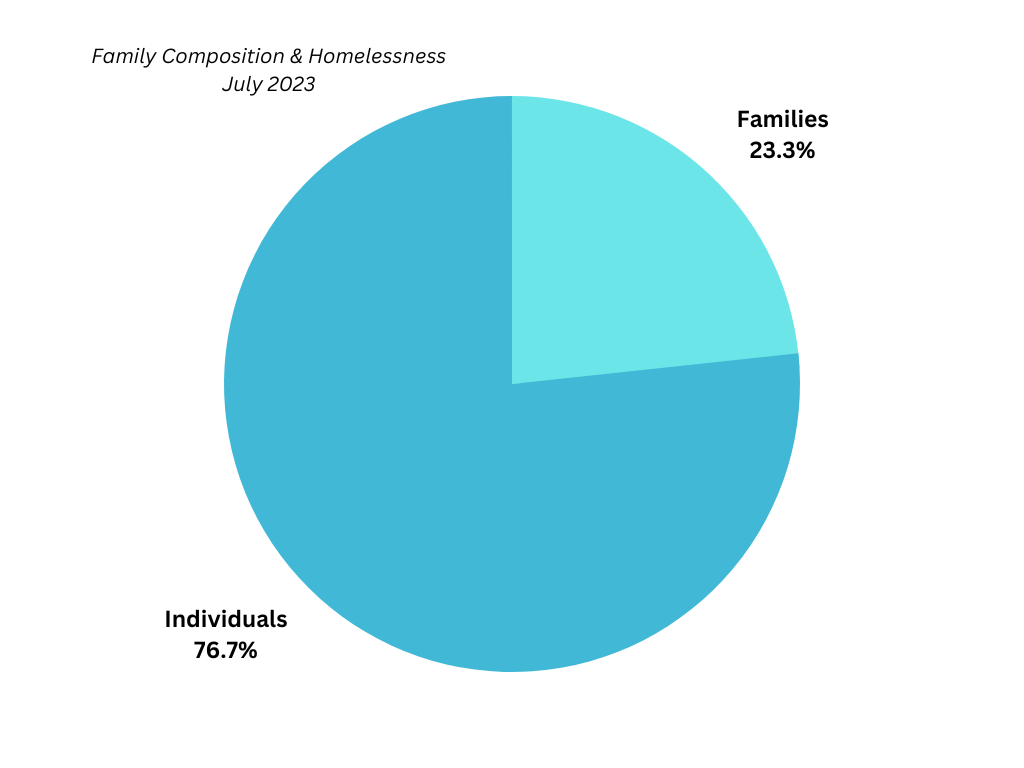
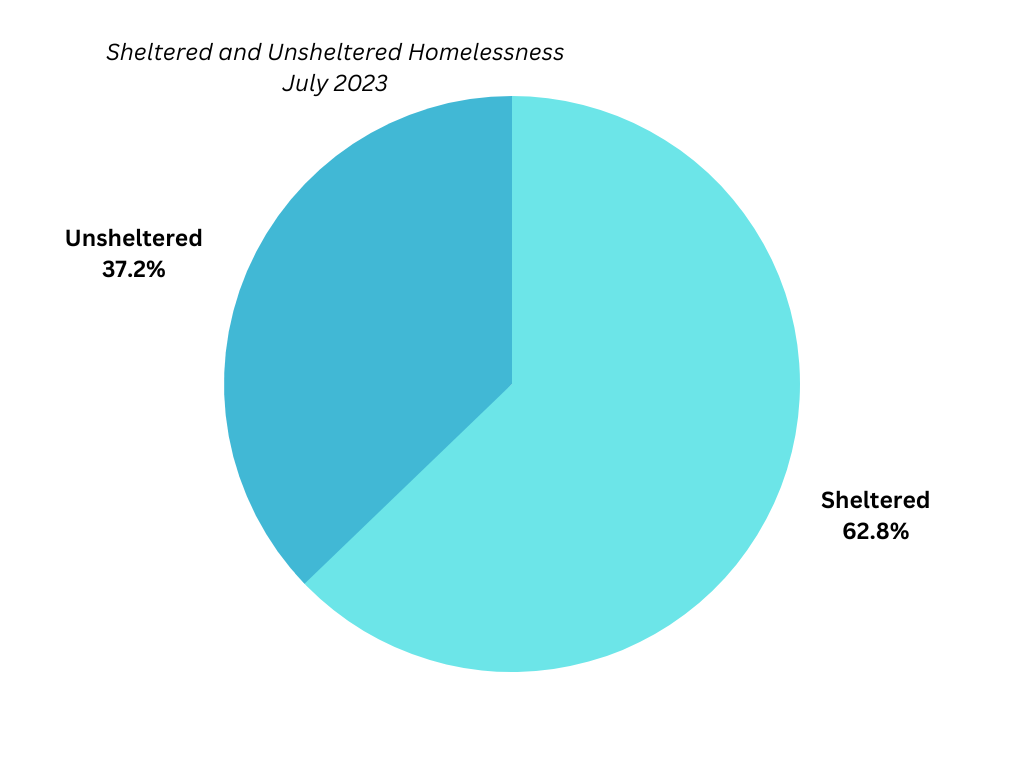
Family Composition
The chart to the left shows the break down between people in families (including all adults and children) and people in adult-only households.
The July 2023 PIT count found 23.3 percent of those experiencing homelessness are people in families (including both children and adults); and 76.7 percent are single adults or adults in adult-only households.