


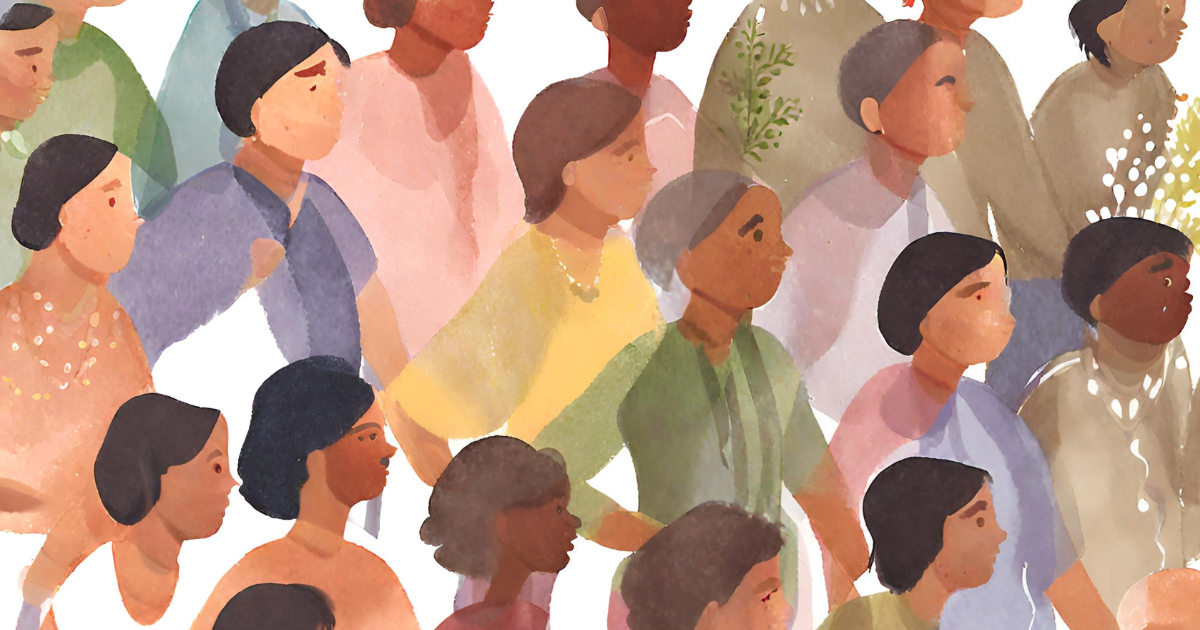
Who Experiences Homelessness in Greater Richmond?
Who comes to mind when you think about individuals experiencing homelessness in our community?
Perhaps you imagine someone living in a tent outside or someone sleeping in their car. You may think of a person staying at an emergency shelter. The ways in which individuals and families experience homelessness vary and it’s important that homeless service providers, advocates, and others have a clear understanding of homelessness in the Greater Richmond region.
That’s one of the central parts of Homeward’s mission: to collect and analyze thorough, rigorous, and verifiable data on individuals and families experiencing homelessness in our region. An important aspect of this data collection is that it’s rooted in lived experience. That means that data comes directly from the people who experience homelessness in our region.
We thought it would be helpful to share a snapshot of our neighbors who experience homelessness in the Greater Richmond region during the past five years.
Total Number of People Experiencing Homelessness
The total number of people experiencing homelessness has fluctuated in the past five years and reached its recent peak in 2021 as a result of the ongoing COVID pandemic. The rate of unsheltered homelessness has dropped in recent years.
| Year | Sheltered | Unsheltered | Total |
|---|---|---|---|
| 2018 | 505 | 104 | 609 |
| 2019 | 327 | 170 | 497 |
| 2020 | 416 | 130 | 546 |
| 2021 | 736 | 98 | 834 |
| 2022 | 612 | 85 | 697 |
Household Composition
Our region’s homelessness population includes many more single adults compared to people in families.
| Year | Families | People in Families | Single Adults |
|---|---|---|---|
| 2018 | 49 | 124 | 485 |
| 2019 | 36 | 115 | 382 |
| 2020 | 39 | 111 | 435 |
| 2021 | 87 | 287 | 547 |
| 2022 | 85 | 259 | 438 |
Gender
Men are more likely to experience homelessness in our region compared to other genders.
| Year | Male | Female | Transgender | Not singularly male or female; nonbinary, genderfluid, agener, culturally specific gender |
|---|---|---|---|---|
| 2018 | 389 | 220 | 0 | 0 |
| 2019 | 335 | 160 | 1 | 1 |
| 2020 | 379 | 167 | 0 | 0 |
| 2021 | 483 | 346 | 5 | 0 |
| 2022 | 436 | 254 | 3 | 4 |
Race
Individuals who identify as Black, African American, or African are far more likely to experience homelessness compared to individuals who identify as other races.
| Year | Black/African American | White | Asian | Indigenous | Hawaiian/Pacific Islander | Multiple Races |
|---|---|---|---|---|---|---|
| 2018 | 389 | 190 | 1 | 5 | 0 | 24 |
| 2019 | 340 | 133 | 2 | 2 | 1 | 19 |
| 2020 | 382 | 129 | 2 | 8 | 1 | 24 |
| 2021 | 598 | 191 | 7 | 3 | 1 | 34 |
| 2022 | 466 | 179 | 3 | 7 | 1 | 41 |
Ethnicity
Individuals who identify as Non-Hispanic make up the vast majority of people experiencing homelessness in our region.
| Year | Hispanic | Non-Hispanic |
|---|---|---|
| 2018 | 25 | 584 |
| 2019 | 37 | 460 |
| 2020 | 19 | 527 |
| 2021 | 17 | 817 |
| 2022 | 33 | 664 |
Age
Individuals between 25 – 54 are most likely to experience homelessness, although our region has seen an increase in homelessness among those under 18 and over 55.
| Year | Younger Than 18 | 18-24 | 25-54 | 55+ |
|---|---|---|---|---|
| 2018 | 74 | 44 | 295 | 196 |
| 2019 | 68 | 20 | 244 | 165 |
| 2020 | 69 | 21 | 254 | 202 |
| 2021 | 162 | 88 | 321 | 263 |
| 2022 | 144 | 67 | 272 | 214 |
Jurisdiction (Last Permanent Residence)
Homeward asks individuals where their last permanent residence was (not where they are staying when counted), and answers are reflected below. The last permanent residence for the majority of individuals experiencing homelessness was in the City of Richmond.
| Year | Richmond City | Henrico | Chesterfield | Hanover | Other VA | Out of State |
|---|---|---|---|---|---|---|
| 2018 | 315 | 54 | 34 | 9 | 86 | 111 |
| 2019 | 265 | 52 | 44 | 3 | 63 | 70 |
| 2020 | 329 | 49 | 30 | 2 | 71 | 60 |
| 2021 | 465 | 72 | 50 | 12 | 132 | 103 |
| 2022 | 389 | 60 | 42 | 10 | 110 | 86 |
*In January 2021, no clients were surveyed; information on shelter clients submitted to HUD came from data in the Homeward Community Information System (HCIS), along with bedcount forms from providers who do not use the system. Information for unsheltered clients was extrapolated from 2022 proportions.
To learn more about how Homeward collects and uses data, visit the data section of our website.
Want to help? Explore ways that you can support homeless services and give back by checking out Homeward - Get Help - Give Help (homewardva.org)


Every donation counts.

Together, we can
end homelessness.
Useful Links
Contact info
info@homewardva.org
If you are within 3 days of losing housing, call The Homeless Connection Line: 804-972-0831 . If you are more than 3 days away from losing housing, call The Housing Resource Line: 804-422-5061